Building an IoT Dashboard – From Raw Telemetry to Real-Time Decisions

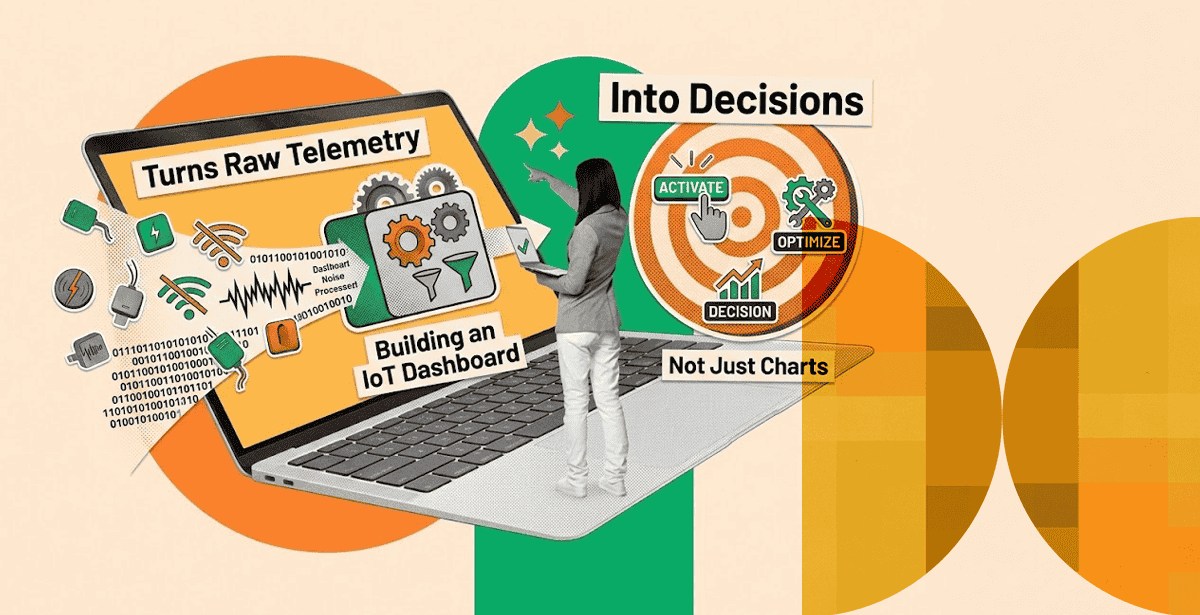
Most teams don’t have an IoT dashboard problem. They have a decision problem wearing a dashboard’s clothes. Telemetry streams in by the millions of datapoints, gets rendered into a line chart, and nobody acts on it until something breaks.
The market is betting heavily that this changes. The IoT device management market alone is projected to grow from $8.8 billion in 2025 to $43.8 billion by 2033, a 21.8% CAGR. That growth only makes sense if dashboards start producing decisions instead of decoration.
Why Most IoT Dashboards Show Data, Not Decisions
A dashboard full of live-updating charts feels productive. It rarely is. If a human has to stare at a graph, notice a slope change, and manually decide something is wrong, the dashboard hasn’t done its job yet.
The fix isn’t more charts. It’s fewer, better ones, backed by logic that already knows what “wrong” looks like before a human has to eyeball it.
This distinction matters more as fleets grow. A dashboard that works for 50 devices, where a person can genuinely eyeball every chart, becomes useless at 5,000 devices. At that scale, the dashboard has to do the noticing, not the human looking at it.
IoT Monitoring Is the Foundation, Not the Finish Line
IoT monitoring answers one question: is the fleet behaving as expected right now? That’s necessary, but it’s the floor of what a modern platform should deliver, not the ceiling.
What IoT Monitoring Should Flag Automatically
Good IoT monitoring catches deviations without a human watching in real time: a sensor reporting outside its expected range, a device that’s gone silent past its check-in window, or a cluster of units in one region showing correlated failures.
DPL’s work managing a smart community platform with 200,000+ connected devices relies on this kind of automated deviation detection across locks, lights, thermostats, and sensors, because no team could manually watch that many devices at once.
Silence is often the hardest failure mode to catch. A device that stops reporting doesn’t generate an alert on its own; it just goes quiet. IoT monitoring has to actively track expected check-in windows per device type and flag the absence of data as its own category of problem, not just out-of-range values.
From Raw Telemetry to IoT Data Analytics That Matter
Telemetry is just numbers until IoT data analytics gives it context. A temperature reading alone means nothing. A temperature reading trending upward against a known equipment failure pattern means a maintenance ticket should already exist.
Turning Time-Series Noise into Signal
Raw sensor streams are noisy by nature. Effective IoT data analytics applies smoothing, baselining, and anomaly detection before anything reaches a human, so what shows up on screen is a signal worth acting on, not a jittery line that means nothing without deep familiarity with the underlying system.
Building on an IoT Cloud Platform That Scales with Device Count
The dashboard is only as good as the IoT cloud platform underneath it. A platform that works fine at 1,000 devices can fall over completely at 100,000, and the failure usually shows up first as dashboard lag or missing data, not an obvious outage.
Where AWS IoT Core Fits Into the Stack
DPL builds on AWS IoT Core, DynamoDB, and Lambda specifically because they scale horizontally with device count rather than requiring a re-architecture every time the fleet doubles.
That architecture is what let DPL’s iApartments platform capture 2 million-plus datapoints from 30,000+ apartments while sustaining sub-$1-per-device monthly operating costs, with a target of 80,000+ connected apartments by 2027.
The IoT cloud platform market was valued at $17.4 billion in 2022 and is projected to reach $51.3 billion by 2030. That growth reflects a real shift: fewer teams building custom ingestion pipelines from scratch, more teams standardizing on managed platforms that already handle device connectivity, message queuing, and fleet indexing at scale.
Latency and Local Processing at the Edge
Not every decision can wait for a round trip to the cloud. Time-sensitive actions, like an emergency shutoff or a security alert, often need to happen at the edge, with the cloud layer handling aggregation, historical analysis, and fleet-wide patterns instead of split-second reactions.
A well-designed IoT cloud platform architecture draws this line deliberately rather than routing every decision through a central server by default.
IoT Analytics Patterns That Actually Drive Action
Not all IoT analytics need to be predictive machine learning. Some of the highest-value patterns are simple, deterministic rules applied consistently at scale, which is often more reliable than a black-box model nobody on the team can explain.
Threshold Alerts vs. Predictive Models
Threshold-based alerts are fast to build and easy to trust: a device outside a known-safe range triggers a notification immediately.
Predictive models add more value over time, forecasting failures before thresholds are even crossed, but they need clean historical data and a real feedback loop to stay accurate. Most mature IoT analytics stacks run both in parallel, using thresholds as a safety net under a predictive layer.
Consider an HVAC cycle-time example. A threshold rule might fire when a unit exceeds a fixed runtime. A predictive model, trained on months of cycle history, could flag the same unit days earlier by recognizing a gradual upward drift long before it crosses any fixed line. Neither replaces the other; they catch different stages of the same failure.
Device Management Platform: The Layer Behind Every Good Dashboard
A dashboard can only show what the device management platform underneath it actually knows. Firmware version, last check-in time, battery health, and configuration state all have to be tracked centrally, or the dashboard is just guessing.
Fleet Health, OTA Updates, and Device Shadows
Device shadows, a virtual representation of each device’s last known and desired state, let a device management platform show accurate status even when a device is temporarily offline. Combined with over-the-air update tracking, this is how a fleet operator knows exactly which devices are running which firmware version without physically checking each one.
DPL’s workforce tracking deployment for a facility management client spanning 50,000+ workers across 18,000+ locations depends on exactly this kind of centralized device state tracking to stay reliable at scale.
Security also lives at this layer. X.509 certificate-based authentication and TLS-encrypted connections mean a device management platform isn’t just tracking state, it’s verifying that every telemetry point on the dashboard actually came from the device it claims to.
Skipping this step doesn’t just create a security gap; it undermines the trustworthiness of every decision the dashboard is meant to support.
💡 Treat device identity as a data quality issue, not just a security requirement. A critical part of securing IoT is ensuring every device can prove its identity before sending data. Strong authentication and encrypted communication not only prevent unauthorized access but also protect the integrity of the telemetry feeding your dashboards, analytics, and automated workflows.
What a Decision-Oriented IoT Dashboard Looks Like in Practice
The clearest sign an IoT dashboard is working: it tells someone what to do next, not just what happened.
A well-built dashboard for a smart residential platform doesn’t show “unit 4B temperature: 78°F.” It shows “unit 4B HVAC cycle time is 3x baseline, dispatch maintenance.”
DPL’s smart communities work has translated into 552,000 manhours saved annually for the client’s operations team, a direct result of dashboards and alerts that route the right issue to the right person automatically instead of surfacing raw numbers for someone to interpret. That’s the real measure of a good IoT dashboard: hours saved, not charts rendered.
Border logistics tells a similar story. DPL’s RFID-based terminal operating system for a national logistics client uses real-time vehicle and cargo tracking to reduce dwell time and give operators full visibility into border crossing operations, turning raw RFID reads into a live operational picture rather than a log file nobody reviews until there’s a problem.
Common Mistakes When Designing IoT Dashboards
Three mistakes show up repeatedly across IoT deployments.
The first is designing the dashboard before defining what decision it’s supposed to support, which produces a wall of charts nobody asked for.
The second is treating every metric as equally important, which buries the handful of numbers that actually matter under dozens that don’t.
The third, and most costly, is building the dashboard without involving the people who’ll actually act on its alerts. A facilities manager and a data engineer often disagree sharply about what counts as urgent. Skipping that conversation is how dashboards end up technically accurate and operationally ignored.
Frequently Asked Questions
What makes an IoT dashboard different from a generic analytics dashboard?
An IoT dashboard has to handle device-specific concerns: connectivity state, firmware versions, telemetry gaps from intermittent connectivity, and fleet-wide health, not just aggregated business metrics.
Do I need machine learning to get value from IoT data analytics?
No. Threshold-based alerting on clean, well-labeled telemetry delivers real value immediately. Predictive analytics is a valuable next step once there’s enough historical data to train on.
How does a device management platform relate to the dashboard itself?
The device management platform is the backend that tracks device state, firmware, and connectivity. The dashboard is the presentation layer built on top of it. Without accurate device management, the dashboard is only ever as reliable as its last stale data point.
What’s the biggest mistake teams make when building an IoT dashboard?
Building for every possible metric instead of the handful that actually trigger a decision. More charts almost always means less clarity, not more.
Should IoT dashboards be built in-house or on a vendor platform?
It depends on device count and customization needs. Smaller fleets often do fine on an off-the-shelf platform, while large or highly specific deployments usually need custom dashboard logic tied directly into the underlying device management platform.
Build a Dashboard That Tells People What to Do
An IoT dashboard earns its place on someone’s screen when it changes what they do next, not just what they know.
DPL has built this stack, from IoT cloud platform architecture through device management and analytics, for fleets ranging from smart residential buildings to nationwide workforce tracking. Explore DPL’s IoT development services to see how a decision-first dashboard could fit your connected device deployment.

Topics
Related Articles
-
A Side-by-Side Comparison of Predictive Maintenance Tools for Industrial Operations
31-Aug-2026 Bilal Sattar
-
The Most Common IoT Security Risks — and the Architecture Decisions That Eliminate Them
28-Aug-2026 Waleed Riaz
-
How Property Technology Is Reshaping Operations for Multifamily and Commercial Real Estate
27-Aug-2026 Waleed Riaz