
IoT Monitoring – How Operations Teams Gain Real-Time Visibility

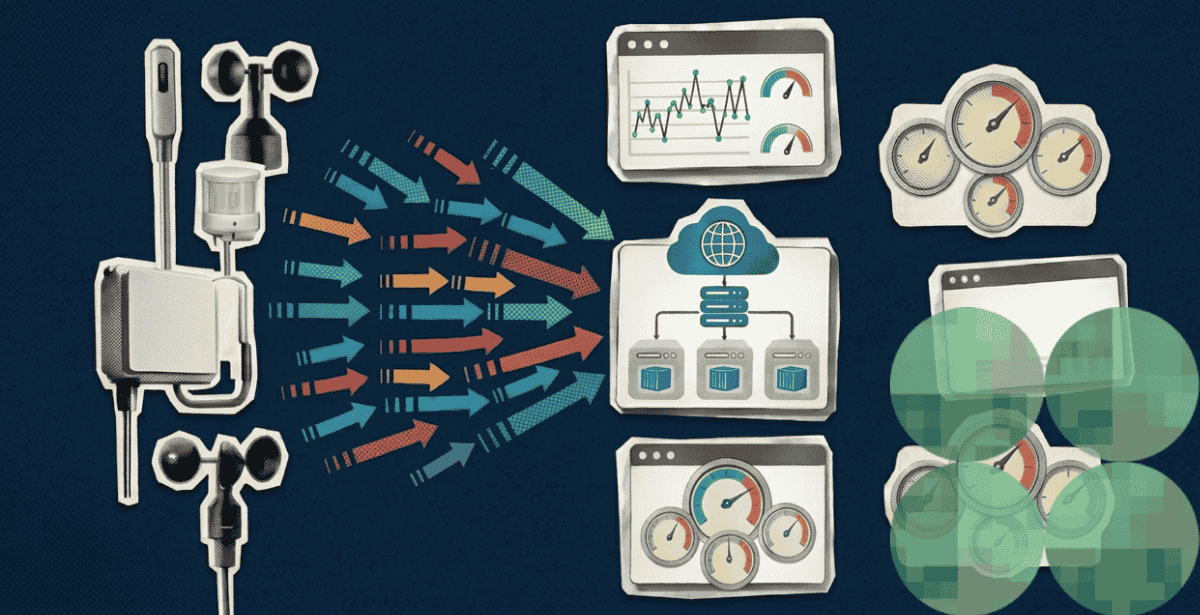
Most operations teams still find out about equipment problems after something breaks. By then, the damage and the downtime are already locked in.
IoT monitoring flips that sequence around entirely. It gives teams visibility into equipment and environments as conditions change, not after the fact.
IoT Remote Monitoring: Visibility Without Being On-Site
IoT remote monitoring lets an operations team watch equipment and environments without a person physically present. That shift matters most for distributed operations spanning many sites at once.
A facilities team managing dozens of locations can’t station someone at every site around the clock. Remote monitoring closes that gap by streaming conditions back to a central team continuously.
Latency matters considerably here, and it varies a lot depending on what’s actually being monitored. A safety-critical alert needs to arrive in seconds; a monthly usage trend can tolerate real delay.
Building both needs into the same monitoring system, without over-engineering the slower use case, takes deliberate architecture. Not every data point deserves the same urgency or the same infrastructure cost.
Connectivity reliability is the other major factor shaping how remote monitoring actually performs in the field. A site with spotty connectivity needs local buffering so data doesn’t simply vanish during an outage.
That buffering question comes up constantly in real deployments, especially across remote or rural sites. Building it in from day one avoids a painful retrofit once the first outage exposes the gap.
Bandwidth cost is another practical constraint that shapes remote monitoring design decisions. Streaming every raw reading continuously from a hundred sites adds up fast on a metered connection.
Compressing or aggregating data at the edge before transmission cuts that bandwidth bill considerably. It also reduces the amount of noise a central team has to sift through later.
The Use of IoT Dashboard for Effective Monitoring
An IoT dashboard is where all the underlying sensor infrastructure finally becomes visible to an actual person. A well-built one turns overwhelming raw data into a handful of decisions worth making.
Too many dashboards try to show everything at once, which defeats the entire purpose of monitoring. A screen with fifty metrics competing for attention helps nobody make a faster decision.
Good dashboard design starts with the decision a viewer needs to make, then works backward from there. Starting from whatever data happens to be available rarely produces a useful result.
That backward design process takes longer upfront than simply exposing every available metric on a screen. It’s time well spent, since the resulting dashboard actually gets used instead of ignored.
Role-based views matter enormously here, since a facilities director and a field technician need genuinely different information. Building one dashboard trying to serve both usually serves neither particularly well.
Separate, purpose-built views drawing from the same underlying data tend to work far better in practice. The engineering cost is small compared to the value each audience gets from a screen built for them.
That small extra investment in view design is one of the highest-leverage decisions in any monitoring project.
The cost of getting this wrong is not abstract, either. It shows up directly in downtime figures across almost every industry that tracks them closely. Those figures are large enough to get any executive’s attention immediately. Finance teams tend to notice them first, often before operations does.
According to Seimens’ The True Cost of Downtime 2024, unplanned equipment downtime costs the average Fortune 500 company $2.8 billion annually, or roughly 11% of revenue. That figure alone justifies real investment in dashboard design, well before any hardware upgrade gets considered.
Alert design deserves the same care as the visual layout. A dashboard that buries critical alerts in noise fails at its core job. Severity levels and clear escalation paths matter more than a polished chart.
💡 Effective monitoring goes beyond displaying telemetry to help teams respond before small issues become major disruptions. Building an IoT dashboard means translating raw telemetry into actionable alerts, historical trends, and contextual insights that help operators identify anomalies, prioritize issues, and make informed decisions without constantly monitoring every metric.
Equipment Monitoring to Detect Problems Before They Escalate
Equipment monitoring is where IoT monitoring delivers its clearest, most measurable return on investment. Catching a developing fault early is dramatically cheaper than repairing a full failure later.
That gap between early detection and reactive repair only widens as equipment ages and complexity grows. A well-tuned monitoring program keeps that gap manageable, quarter after quarter. It rarely lets that gap turn into an expensive surprise down the line, even as fleets grow larger.
Fortune 500 companies could save an estimated $233 billion in maintenance costs annually with full condition monitoring adoption. That potential remains largely untapped across most industries today. Even firms already running some form of monitoring rarely capture the full savings available to them.
Vibration, temperature, and current draw are the most common signals used for equipment monitoring in industrial settings. Each one telegraphs a different category of developing mechanical or electrical problem.
Combining multiple signal types tends to catch failures that any single signal would miss on its own. A bearing failure, for example, often shows up in both vibration and temperature readings together.
Alert thresholds for each signal need calibration against the specific equipment being watched, not a generic default. A threshold copied from a different asset class produces false alarms or missed warnings.
That calibration work takes real domain expertise, not just a vendor’s factory default settings. Getting it right is what separates monitoring that actually gets trusted from monitoring that gets ignored.
Case Study: How DPL Ensured Real-Time Visibility Across 50,000+ Workers and 18,000+ Locations
Our client, National Janitorial Solutions, needed real-time visibility into workforce location and activity across a huge, distributed footprint. Manual check-ins couldn’t scale to the size of the operation.
We built a WiFi-based indoor location tracking system that the client deployed across more than 50,000 workers. The system covers over 18,000 locations spanning all 50 US states simultaneously.
Through the system, supervisors gained live visibility into workforce presence and activity across every site, all at once. That visibility replaced a patchwork of manual processes that never scaled well past a handful of locations.
The Role of the IoT Sensor in Monitoring Programs
An IoT sensor is where monitoring data originates, and its quality sets a hard ceiling on everything built above it. No dashboard or analytics layer can fix data that was never accurate to begin with.
Sensor placement, calibration, and update frequency all shape whether monitoring output can actually be trusted. Getting these right takes real planning, not just ordering hardware off a spec sheet.
Redundancy is worth considering for any signal an operations team genuinely can’t afford to lose. A second sensor on a critical asset costs little compared to a missed failure warning.
Sensor lifespan also shapes long-term monitoring reliability more than most teams initially plan for. A sensor that degrades quietly over time produces increasingly unreliable readings without any obvious failure signal.
Scheduled sensor audits catch this quiet drift before it undermines confidence in the entire monitoring system. That small maintenance habit protects the credibility of everything built on top of it.
💡 Not all sensors are built for the same operating conditions. Choosing the right IoT sensor requires evaluating measurement range, environmental tolerance, response time, power consumption, and long-term stability against the application’s specific needs. Matching these factors to real-world conditions helps prevent inaccurate readings, premature hardware failure, and costly replacements.
Condition Monitoring: From Reactive Repairs to Predictive Action
Condition monitoring is the specific discipline of tracking equipment health continuously rather than waiting for scheduled inspections. It’s the mechanism that makes predictive maintenance possible in the first place.
Baseline data matters enormously for condition monitoring to work well in practice. A system needs weeks or months of normal operating data before it can reliably flag abnormal behavior. Skipping that baseline period produces alerts nobody can actually trust yet.
That baseline-building period is often underestimated during project planning, leading to unrealistic early expectations. Teams that budget for it upfront avoid disappointment when a new system doesn’t flag issues on day one.
Communicating that timeline clearly to stakeholders before launch prevents a common, avoidable disappointment. A monitoring system that needs a few months to mature is not a failed monitoring system.
That baseline period is also when a team should document what normal actually looks like for future reference. Skipping that documentation step makes onboarding a new engineer far harder later on.
💡 Reliable condition monitoring depends on more than collecting sensor readings; it also requires efficient data processing and communication. AWS IoT Core supports device connectivity, message routing, and device state management, helping teams deliver telemetry to cloud services for analysis with minimal delays. Choosing the right data flows and processing architecture can improve monitoring responsiveness and support faster maintenance decisions.
Those same architecture choices determine how gracefully the system handles a sudden spike in reporting volume. A design that works at pilot scale doesn’t always hold up at full rollout. Every site coming online at once, reporting simultaneously, is a different load pattern entirely.
Planning for that eventual scale during initial architecture avoids a costly redesign once real traffic arrives. Retrofitting scale into a system built without it in mind is rarely cheap or fast. That kind of retrofit usually happens under real deadline pressure too.
Security matters just as much in a monitoring system as anywhere else in a connected environment. A monitoring pipeline that ingests sensor data is still an attack surface worth protecting carefully. That protection has to run from the sensor up through the dashboard.
A compromised monitoring system is worse than no monitoring at all. It can report false confidence to an operations team that trusts it. Treating monitoring infrastructure with the same security rigor as any production system is essential, not optional.
Building Monitoring That Operations Teams Actually Trust
IoT monitoring only delivers value when operations teams trust what it’s telling them enough to act on it. A system that cries wolf too often gets ignored, no matter how sophisticated its underlying architecture is on paper.
That trust gets built slowly through months of accurate alerts and lost quickly through a handful of bad ones. Protecting it deserves the same ongoing attention as any other part of the system, not a one-time setup checklist.
And that’s where we come in the picture.
DPL’s IoT development specialists have built real-time monitoring systems spanning workforce tracking, smart communities, and industrial deployments. We’re always ready to replicate our success for you, ensuring you get the most from your connected devices.
Let us know how we can help via the form below.

Topics
Related Articles
-
Choosing the Right IoT Sensor for Temperature, Humidity, Vibration, and Beyond
02-Nov-2026 Umer Shamim Qureshi
-
IoT Data Management – A Guide to Storing and Processing Billions of Data Points
23-Sep-2026 Ali Akbar
-
How to Choose an IoT Cloud Platform for Millions of Connected Devices
21-Sep-2026 Umer Shamim Qureshi